/DATA ANALYTICS
E-Commerce Sales Dashboard - Power BI
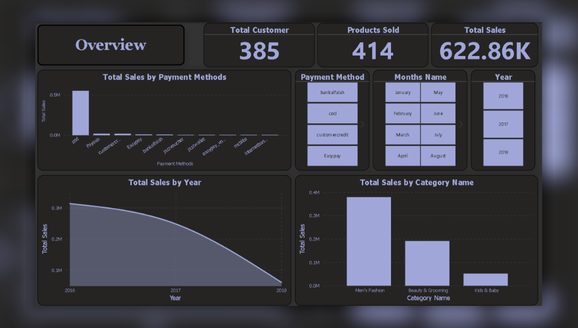
Power BI dashboard providing category-wise sales, payment trends, and customer insights from e-commerce data.
- Tools & technologies
- Power BI, Data Visualization, Business Intelligence
- Data
- Source details to be added
- Explore
- View GitHub
A look at the project
This project involved analyzing 6 months of e-commerce sales data across Men Fashion, Beauty and Grooming, and Kids and Baby categories to uncover trends, optimize category performance, and improve payment method strategies.
Key Achievements
- Cleaned and transformed raw sales data using Power Query
- Built a calendar table and established relationships for time-based analysis
- Developed calculated columns and measures in DAX for KPIs
- Designed a 4-page interactive Power BI dashboard with category-specific analysis
- Identified category-wise sales performance and payment method patterns
Technologies Used
- Power BI for data visualization and analytics
- DAX for advanced calculations
- Power Query for ETL and data cleaning
- Interactive dashboarding techniques for stakeholder reporting
Challenges Solved
- Filtering and analyzing data for specific categories and time frames
- Optimizing visuals for clarity and interactivity
- Handling diverse payment method data and ensuring accurate aggregation
Results
- Enabled data-driven decision-making for category prioritization
- Highlighted top-performing categories and underperforming segments for targeted strategies
- Provided clear insights into payment method preferences to guide future promotions
- Delivered a professional, easy-to-use dashboard for stakeholders to explore sales trends