/DATA ANALYTICS
Investment Performance Monitor - Power BI + Snowflake + Airflow
An investment analytics pipeline combining Python, Apache Airflow, Snowflake and Power BI. Dashboard portfolio values use sample data.
- Tools & technologies
- Power BI, Snowflake, Apache Airflow (Docker), Python, Web Scraping, Data Modeling, SQL
- Data
- Sample / demonstration data
- Explore
- View GitHub
A look at the project
This project began as a way to understand Apache Airflow but evolved into a full end-to-end analytics solution that tracks an investment portfolio across multiple markets.
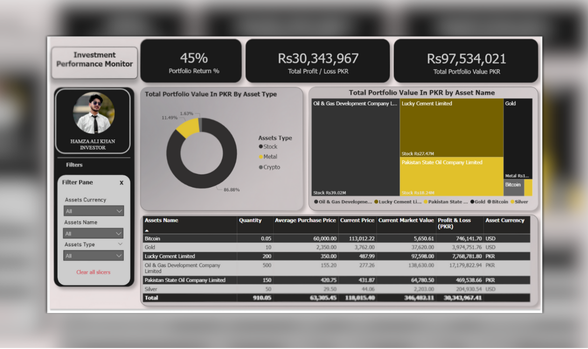
The dashboard gives users a single place to monitor the value of their assets—including stocks, cryptocurrencies, precious metals, and currency exchange rates—without hopping between platforms.
Key Achievements
- Combined API data (Yahoo Finance) and web scraping (Pakistan Stock Exchange) into one dataset
- Staged and validated user CSV uploads directly into Snowflake for secure ingestion
- Built Airflow DAGs to automate and schedule data extraction, transformation, and loading
- Modeled and optimized data in Snowflake for fast Power BI queries and responsive visuals
- Designed an interactive Power BI dashboard showing live portfolio value, profit/loss, and market comparisons in PKR
Technologies Used
- Python for API calls, data processing, and web scraping
- yfinance for real-time crypto, metals, and currency rates
- BeautifulSoup for scraping PSX stock prices
- Apache Airflow (Docker) for orchestration and scheduling
- Snowflake for data storage, transformations, and modeling
- Power BI for visualization, DAX measures, and KPI tracking
Challenges Solved
- Integrating multiple real-time data sources (APIs + web scraping) into a single pipeline
- Staging and validating user-uploaded CSV files before ingestion into Snowflake
- Designing a scalable data model to handle live updates without performance bottlenecks
- Building a dashboard that converts all values to PKR in real time
Results
- A fully automated investment dashboard that consolidates assets and markets into a single view
- Real-time profit/loss and portfolio performance insights refreshed through Airflow scheduling
- Hands-on experience blending data engineering and analytics in a practical finance scenario
- Demonstrates a complete ELT workflow from ingestion to visualization
⚠️ Note: Dashboard visuals use mock/sample data for demonstration purposes only (including profits and portfolio values).
Limitations & context
Dashboard profits and portfolio values are mock/sample data for demonstration.