/DATA ANALYTICS
Karachi Weather Forecast Dashboard - Power BI
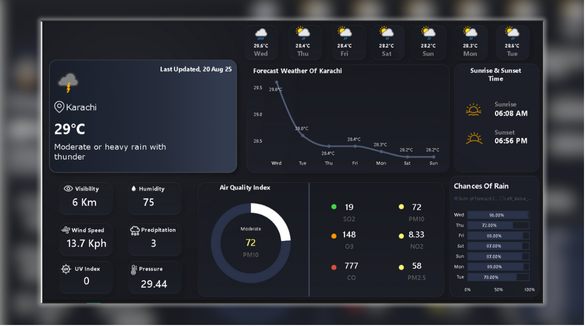
A Power BI dashboard bringing Karachi weather, a seven-day forecast and air-quality indicators into one view.
- Tools & technologies
- Power BI, API Integration, Data Modeling, DAX
- Data
- Source details to be added
- Explore
- View GitHub
A look at the project
This project was a quick build I created in one day during free time, aiming to make something useful by combining data visualization with real-time weather insights. The dashboard focuses on Karachi’s weather, showing temperature, humidity, wind speed, and forecast trends.
Key Achievements
- Integrated live weather API data directly into Power BI
- Modeled and transformed raw JSON responses into structured datasets
- Built calculated measures and time-based visuals for daily/weekly forecasts
- Designed an interactive dashboard with charts, cards, and trend indicators
- Delivered a lightweight solution that updates automatically with fresh API calls
Technologies Used
- Power BI for data visualization and dashboarding
- Power Query for data cleaning, JSON transformation, and ETL
- DAX for calculated measures and KPIs
- OpenWeather API (or any weather API) for real-time weather data
Challenges Solved
- Handling API authentication and connecting JSON responses to Power BI
- Structuring forecast data for multiple timeframes (daily vs weekly)
- Designing visuals that are clear and user-friendly for quick weather insights
Results
- A real-time weather dashboard that shows Karachi’s forecast in an easy-to-understand way
- Fully automated updates with API integration—no manual refresh required
- A practical and simple data product that demonstrates how APIs and Power BI can be combined
- Gave me hands-on experience with live API integration into BI tools, beyond static datasets